|
HOMA metabolic assessment in normoglycemic and diabetic canines
RESEARCH ARTICLE
Franco González-Villar1
1 Faculty of Veterinary and Animal Sciences, University of Chile 2 Institute of Nutrition and Food Technology (INTA), University of Chile, Santiago, Chile This email address is being protected from spambots. You need JavaScript enabled to view it.
Received: 06 september 2018, Approved: 24 march 2019, Updated: 16 june 2019
DOI: 10.17151/vetzo.2019.13.2.2
SUMMARY. Introduction: Diabetes mellitus is caused by an increase in blood glucose levels, a phenomenon mediated by environmental and genetic factors. This increase in blood glucose levels may be due to a partial or absolute failure to produce insulin as well as a loss in tissue sensitivity to insulin. Given that diabetic patients respond only to insulin therapy and are mostly thin, canines can develop insulin resistance, without developing glucose intolerance or diabetes. Aims: We aim to evaluate insulin resistance using the mathematical model homeostatic model assessment (HOMA) in patients with different body condition. Insulin levels were determined using the IRMA assay, and X2 test and analysis of variance (ANOVA) were used for the statistical analysis. Results: ANOVA between the groups showed no significant differences between the normoglycemic HOMA group of the obese and normal weight patients and between the diabetic and normal weight HOMA group. The X2 correlation index did not show a significant association between the body condition and the altered HOMA index (X2 = 3.056, p = 0.08). Insulin levels were higher in obese patients than in those with normal weight, although the difference was not significant (F = 1.004, p = 0.394). Conclusion: In addition, there were no significant differences in HOMA levels associated with increases in the body condition, which could be related with a higher state of insulin deficiency over the state of insulin resistance.
Evaluación metabólica del índice HOMA en caninos normoglicémicos y diabéticos
RESÚMEN. Introducción: La Diabetes Mellitus es una patología producida por un aumento en los niveles de glucosa a nivel sanguíneo, fenómeno mediado por factores ambientales y genéticos. Esta alza en los niveles de glicemia se puede deber a una falla en la producción, ya sea parcial o absoluta de insulina, así como también por una pérdida en la sensibilidad a la insulina por parte de los tejidos. Dado que los pacientes diabéticos solo responden a manejos de insulinización, y que son en su mayoría delgados, estos caninos pueden tener insulinoresistencia, sin llegar a desarrollar intolerancia a la glucosa o diabetes. Objetivo: El objetivo de este trabajo fue evaluar la insulinoresistencia por medio del modelo matemático HOMA en pacientes con distinta condición corporal. Métodos: Se determinaron los niveles de insulina a través de ensayo IRMA y el análisis estadístico utilizó prueba de X2 y análisis de varianza ANOVA. Resultados: El análisis de varianza ANOVA entre los grupos, no mostró diferencias estadísticamente significativas entre el grupo HOMA normoglicémico del paciente obeso y normopeso, así como tampoco entre el grupo HOMA diabético y normopeso. El índice de correlación X2 no mostró una asociación significativa entre la condición corporal y el índice HOMA alterado, (X2 =3,056; p = 0.08). Los niveles de insulina fueron mayores en pacientes obesos respecto a normopeso, aunque esta diferencia no fue estadísticamente significativa (F = 1.004; p = 0.394). Conclusión: El estudio realizado no mostró diferencias significativas en los niveles HOMA asociada a aumentos en su condición corporal, lo cual se podría relacionar a un mayor estado de insulinodeficiencia por sobre el estado de insulinoresistencia.
Introduction
Diabetes mellitus is characterized by an increase in blood levels of glucose, mediated by environmental and genetic factors. This increase in blood glucose levels may be caused by a partial or complete failure to produce insulin as well as loss in tissue sensitivity to insulin (Feldman et al, 2014).
A recent study at the University of Pennsylvania found that human and canine islets of Langerhans are different. In humans, 54% correspond to β cells, 35% to α cells, and 11% to other cell types. However, in canines, 80% correspond to β cells, 10% to α cells, and 10% to pancreatic polypeptide and somatostatin; therefore, extensive damage of the pancreas is necessary for it to show signs, which could explain the later onset of diabetes mellitus in dogs. The loss of these β cells can explain the number of insulin-dependent canines, thus showing a similarity between canine and human type 1 diabetes (Cox et al, 2015).
Genetic predisposition, infections, medications causing insulin resistance, obesity, and pancreatitis are diabetes mellitus predisposing factors. This interaction results in an irreversible loss of pancreatic β-cell function together with insulin resistance status (Couto and Nelson, 2010).
After characterizing the canine genome, various chronic conditions and their breed predisposition have been studied. Thus, some breeds show a greater susceptibility to diabetes mellitus such as the Samoyed and the Cairn Terrier, whereas other breeds such as the Boxer, German Shepherd, and the Golden Retriever present a very low prevalence of this condition (Davison et al, 2005).
Studies on diabetic dogs have found polymorphisms in the major histocompatibility complex class II, specifically for the dog leukocyte antigen (DLA) haplotype (Abbas et al, 2014).
Studies in canines have found a correlation between diabetic dogs and the DLA haplotypes: DLA-DRB1, DLA-DQA1, and DLA-DQB1 (DRB1 009/DQA1 008, DRB1 015/DQA1 0061/DQB1 023, y DRB1 002/DQA1 009/DQB1 001), with significant increases in diabetic patients (Kennedy et al, 2006).
Studies on the prevalence of canine obesity conducted in North America by the Association for Pet Obesity Prevention have found that approximately 55% dogs and cats are overweight or obese to a certain extent, and of these, 45% are unnoticed by the owners (Churchill et al, 2016).
Obesity and its role in canine insulin resistance are controversial because some authors have found an obesity-related metabolic dysfunction in canines as well as in humans, and 20% obese dogs have this dysfunction at the metabolic level (Tvarijonaviciute et al, 2012). When assessing the alteration involved in insulin resistance, some authors have determined peripheral rather than hepatic resistance when canines were fed high fat hypercaloric diets, both at the visceral and peripheral levels (Kim et al, 2003). Despite this, some studies mainly focused on the omental visceral adipose tissue in canines have not found a correlation between this tissue and insulin resistance (Castro et al, 2015).
Australian studies assessing the possible factors involved in the absence of diabetes mellitus in obese dogs found that dogs with increased visceral adipose tissue do not decrease adiponectin secretion, which is one of the main insulin-sensitizing cytokines and whose decrease is one of the main insulin resistance factors present in obese individuals (Verkest et al, 2011).
Some studies have tried to establish methods to assess insulin resistance in dogs, e.g., the insulin resistance measurement mathematical model known as HOMA (homeostatic model assessment) establishes values for insulin resistance above 2.9 in dogs (Verkest et al, 2010). Despite being useful in clinical practice, these models are inaccurate when determining the progression from insulin resistance to glucose intolerance. In addition, the presence of pancreatic conditions frequently found in diabetic patients affects the accuracy in dogs (Ader et al, 2014). Herein we assessed insulin resistance using the HOMA model in patients with different body conditions to elucidate the role of this metabolic condition in the development of glucose intolerance and/or diabetes.
Material and Methods
Blood sampling was performed through venipuncture in the cephalic vein, which was subsequently placed in a tube containing anticoagulant and in another with EDTA as an anticoagulant. The sample was centrifuged at 5000 rpm for 10 min at 21°C to separate the plasma and serum.
The study groups were divided into four subgroups: diabetic patients with insulin management, diabetic patients without insulin management, normal weight normoglycemic patients, and overweight or obese normoglycemic patients. Those patients presenting glycemia >200 mg/dl were diagnosed with diabetes, as established by the AAHA guidelines (Rucinsky et al, 2010), whereas those with glycemia up to 110 mg/dl were considered normoglycemic subjects. Body condition was assessed using a nine-point morphometric body condition score. Patients with scores 5/9 were considered to have an ideal body condition, those with a score >5/9 were overweight, and those with a score of 8 were obese, according to the WSAVA guidelines (Biourge et al, 2008).
A total of 79 patients were studied that were grouped into 24 diabetic patients without therapy, 16 diabetic patients receiving insulin therapy, 19 normal weight normoglycemic patients, and 20 obese or overweight normoglycemic patients. The HOMA index was calculated as (glucose level × insulin level)/405, considering normal levels as those below 2.9 (Verkest et al, 2010).
Insulin levels were measured using the Perkin Elmer Wallac 1470-002 Wizard Gamma Counter Kit. DIAsource INS-IRMA Kit presented an intra-assay coefficient of variation of 0.29%–2.93%, inter-assay coefficient of variation of 1.12%–3.16%, internal standard coefficient of variation under 2.27%, and a detection limit of 1.00 μUI/ml.
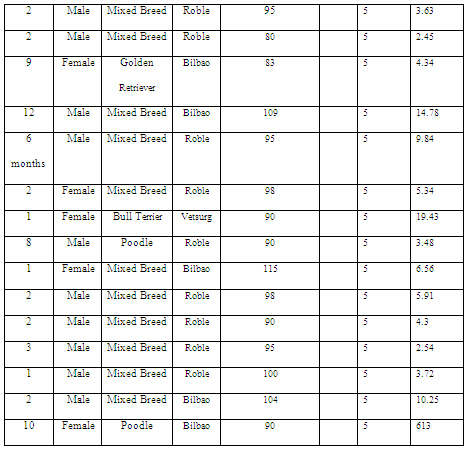
The HOMA index was assessed in eight diabetic patients with a body condition score of ≥6/9, 16 diabetic patients with a score of ≤5/9, 17 normoglycemic patients with a score of ≥6/9 (Table 1), and 15 patients with a score of 5/9, which was used as a control group (Table 2).
Table 1: HOMA index in overweight and obese patients.
Table 2: HOMA index in normal weight patients.
The correlation analysis was conducted using the 2 test for categorical variables, with 2 × 2 tables assessing body condition and HOMA index. The HOMA index difference of the different populations was studied by analysis of variance (ANOVA).
Results and Discussion
Breed data analysis was performed using ANOVA to identify the differences in HOMA indices between the purebreds and mixed breeds. No significant differences were observed in the obese purebreds and mixed breeds (F = 0.210; p = 0.649) as well as in normal weight patients in terms of the HOMA index (F = 0.027; p = 0.868). In contrast, another study on diabetes mellitus reported certain predisposition in some breeds such as the Samoyed and the Cairn Terrier (Davison et al, 2005).
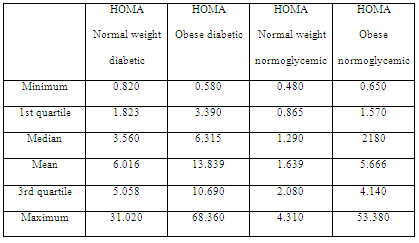
When assessing HOMA index levels in diabetic patients, higher levels were observed when compared with the normoglycemic group (Table 3). However, ANOVA of the four groups showed no significant differences between the HOMA normoglycemic groups of the obese and normal weight patients (F = 0.182; p = 0.670) and between the HOMA obese diabetic and normal weight diabetic group (F = 0.090; p = 0.965).
Table 3: HOMA index in diabetic, normoglycemic, normal weight and obese patients.
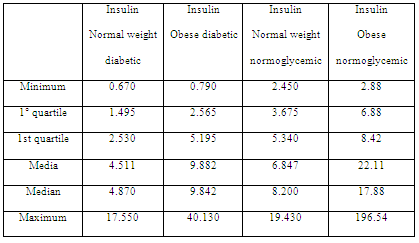
Table 4: Insulin levels in diabetic, normoglycemic, normal weight and obese patients.
In addition, no significant association was observed between the body condition and number of patients with altered HOMA index (2 = 3,056; p = 0.08). Of the 15 control patients, 13 showed HOMA scores of <2.9; only two with a score of >2.9; whereas among overweight and obese patients, 10 and 7 had scores of <2.9 and >2.9, respectively.
Metabolic analysis showed that insulin resistance assessed using the HOMA index did not reflect a significant relationship with the body condition. This could suggest a greater implication of insulin level for assessing insulin resistance (Table 4), which is consistent with the data of another study on cardiovascular diseases associated with weight and hyperinsulinemia (Tropf et al, 2017). Despite the differences in mean insulin levels, insulin levels were higher in obese patients than in normal weight ones, and this difference was not significant when performing ANOVA (F = 1.004; p = 0.393). However, insulin in patients with greater body condition tended to increase, which is consistent with what another study established regarding insulin resistance in canines (Verkest et al, 2011).
When assessing body condition in diabetic patients, 15 of the 40 patients presented with a score of >5/9 at the time of sampling. All these 15 patients had low insulin levels and required insulin. It could not be clearly determined whether they had type 1 diabetes or type 2 diabetes that had become type 1 diabetes due to pancreatic β cells glucotoxicity. Canines could be classified as being closer to the phenotype of a human with type 1 diabetes when there is an apparent lack of insulin-resistant factors associated with obesity, which then progresses into a state of glucose intolerance as well as the need for insulin use in most patients (Catchpole et al, 2008).
Conclusion
We found no significant alteration between the HOMA index and the weight of dogs, which would confirm the state of insulin deficiency by insulin resistance, thus proving the metabolic differences between humans and canines. Thus, further studies are required to focus on autoimmune diseases that could supplement underlying mechanisms in this species.
Bibliographic References
Abbas, A. K., Lichtman, A. H., Pillai, S. Basic immunology: functions and disorders of the immune system. Elsevier Health Sciences 2014.
Ader, M., Stefanovski, D., Richey, J. M., Kim, S. P., Kolka, C. M., Ionut, V., Bergman, R. N. Failure of homeostatic model assessment of insulin resistance to detect marked diet-induced insulin resistance in dogs. Diabetes 2014; 63(6): 1914-1919.
Biourge V, Elliott D, Pibot P. Enciclopedia de la Nutrición Clínica Canina. Royal Canin. Paris, Editorial Aniwa Pub 2008; 514 pp.
Feldman, E., Nelson, R., Reusch, C., Scott-Moncrieff, J. Canine and feline endocrinology. Elsevier Health Sciences 2014; pp 214-219.
Catchpole, B., Kennedy, L. J., Davison, L. J., Ollier, W. E. R. Canine diabetes mellitus: from phenotype to genotype. Journal of Small Animal Practice 2008; 49(1): 4-10.
Castro, A. V., Woolcott, O. O., Iyer, M. S., Kabir, M., Ionut, V., Stefanovski, D., Paszkiewicz, R. L. Increase in visceral fat per se does not induce insulin resistance in the canine model. Obesity 2015; 23(1): 105-111.
Churchill, J., Ward, E. Communicating with pet owners about obesity: Roles of the Veterinary Health Care Team. Veterinary Clinics of North America: Small Animal Practice 2016; 46(5): 899-911.
Couto, C., Nelson, R. Medicina Interna de pequeños animales. España, Editorial Elsevier 2010; 1467 pp.
Cox, A., Hess, R., Kushner, J., Lam, C., Rankin, M., Shields, E., Van Winkle, T. Extreme beta-cell deficiency in pancreata of dog with canine diabetes. PLoS One 2015; 10: 1-19.
Davison, L.J., Herrtage, M.E., Catchpole, B. Study of 253 dogs in the United Kingdom with diabetes mellitus. Veterinary Record 2005; 156: 467-471.
Kennedy, L. J., Davison, L. J., Barnes, A., Short, A. D., Fretwell, N., Jones, C. A. Catchpole, B. Identification of susceptibility and protective major histocompatibility complex haplotypes in canine diabetes mellitus. Tissue Antigens 2006; 68(6): 467-476.
Kim, S. P., Ellmerer, M., Van Citters, G. W., Bergman, R. N. Primacy of hepatic insulin resistance in the development of the metabolic syndrome induced by an isocaloric moderate-fat diet in the dog. Diabetes 2003; 52(10): 2453-2460.
Rucinsky, R., Cook, A., Haley, S., Nelson, R., Zoran, D. L., Poundstone, M. AAHA diabetes management guidelines for dogs and cats. Journal of the American Animal Hospital Association 2010; 46(3): 215-224.
Tropf, M., Nelson, O. L., Lee, P. M., Weng, H. Y. Cardiac and metabolic variables in obese dogs. Journal of Veterinary Internal Medicine 2017; 31(4): 1000-1007.
Tvarijonaviciute, A., Ceron, J. J., Holden, S. L., Cuthbertson, D. J., Biourge, V., Morris, P. J., German, A. J. Obesity-related metabolic dysfunction in dogs: a comparison with human metabolic syndrome. BMC Veterinary Research 2012; 8: 147.
Verkest, K. R., Rand, J. S., Fleeman, L. M., Morton, J. M., Richards, A. A., Rose, F. J., Whitehead, J. P. Distinct adiponectin profiles might contribute to differences in susceptibility to type 2 diabetes in dogs and humans. Domestic Animal Endocrinology 2011; 41(2): 67-73.
Verkest, K. R., Fleeman, L. M., Rand, J. S., Morton, J. M. Basal measures of insulin sensitivity and insulin secretion and simplified glucose tolerance tests in dogs. Domestic Animal Endocrinology 2010; 39(3): 194-204.
Como citar: González-Villar, F.; Perez-Bravo, F. HOMA metabolic assessment in normoglycemic and diabetic canines. Revista Veterinaria y Zootecnia. n, v. 13, n. 2, p. 14-23, 2019. http:// vetzootec.ucaldas.edu.co/index.php/component/content/article?id=273. DOI: 10.17151/vetzo.2019.13.2.2
Esta obra está bajo una Licencia de Creative Commons Reconocimiento CC BY
|


 | Today | 71 |
 | Yesterday | 351 |
 | This week | 422 |
 | Last week | 3121 |
 | This month | 10455 |
 | Last month | 18517 |
 | All days | 1373586 |
Online Now: 23
Your IP: 3.145.88.111
MOZILLA 5.0,
Today: December 24, 2024
Your IP: 3.145.88.111
MOZILLA 5.0,
Today: December 24, 2024