|
Association between conformation traits and productive performance in Holstein cows in the department of Antioquia, Colombia1
ARTÍCULO DE
Recibido: 10 Febrero 2014 Aprobado: 15 Julio 2014 Actualizado: 19 Noviembre de 2014)
ABSTRACT: The objective of this research was to estimate the phenotypic association between some conformation traits and dairy traits in the Antioquia Holstein dairy cattle. To achieve this, 8037 records from 139 herds located in the department of Antioquia, Colombia were analyzed. Data were obtained from a control program performed between 2008 and 2011. The phenotypic association was carried out through three different statistical analyzes: a generalized linear model, a regression analysis and the Pearson correlation coefficient. It was found that the main linear traits associated with productive traits were body compound (index comprised by stature, chest width, angularity, and rump angle) and udder compound (index comprised by udder depth, fore udder attachment, rear udder height, rear udder width, central ligament, front teat position and rear teat position) fore udder attachment, teat length, rear teat position and udder depth. The highest regression coefficient was for milk yield on udder compound (510.67 l/lac); the lowest was for fat percentage on udder depth (0.028%). The highest correlation was between milk yield and udder depth (-0.21), and the lowest was between fat percentage and front teat position (0.00). These results indicate that the phenotypic association between conformation traits and productive parameters tends to be low. This is the reason why it is important to estimate genetic correlations and to determinate their importance and possible use in genetic improvement programs.
Key words: regression analysis, dairy traits, phenotypic correlation, linear appraisal.
Asociación entre características de conformación y desempeño productivo en vacas Holstein del departamento de Antioquia, Colombia
RESUMEN: El objetivo de esta investigación fue estimar la asociación fenotípica entre algunas características de conformación y características lecheras en ganado Holstein del departamento de Antioquia. Para ello se analizaron 8037 registros pertenecientes a 139 hatos ubicados en el departamento. Los datos se obtuvieron de un programa de control realizado entre los años 2008 y 2011. La asociación fenotípica se llevó a cabo mediante tres análisis estadísticos diferentes: un modelo lineal generalizado, un análisis de regresión y la determinación del coeficiente de correlación de Pearson. Se encontró que las principales características lineales asociadas con parámetros productivos fueron el compuesto corporal (índice compuesto de estatura, ancho de pecho, angulosidad y el ángulo de grupa) y de ubre (índice compuesto por la profundidad de ubre, inserción anterior de ubre, altura de ubre trasera, ancho de ubre posterior, ligamento central, posición de pezones delanteros y la posición de pezones posterior), inserción anterior de la ubre, largo de pezones posteriores, colocación de pezones posteriores y profundidad de ubre. El mayor coeficiente de regresión fue de la producción de leche en el compuesto de ubre (510,67 l/lac); el más bajo fue del porcentaje de grasa en la profundidad de ubre (0,028%). La correlación más alta fue entre producción de leche y profundidad de ubre (-0,21), y la menor entre porcentaje de grasa y posición de pezones anteriores (0,00). Estos resultados indican que la asociación entre características de conformación y los parámetros productivos tiende a ser baja. Por esto es importante estimar las correlaciones genéticas y determinar su importancia y posible uso en los programas de mejoramiento genético.
Palabras clave: análisis de regresión, características lecheras, correlación fenotípica, evaluación lineal.
Introduction
The dairy cattle in Colombia have been traditionally selected for milk yield and lately for milk quality with a strong emphasis on protein and fat percentage. But it is well known that selection for milk traits leads to decreased disease resistances, reproductive efficiency and productive life (Ptak et al., 2008; Samoré et al., 2010; Corrales et al., 2011).
The inclusion of functional traits in the selection index, such as longevity and somatic cell scores, can reduce herd replacement, veterinary and management costs (Samoré et al., 2010), increasing profitability of herdsas a consequence of the increased number of cows producing in latter lactations, a decrease in disease onset and delaying involuntary culling (Valencia et al., 2008). Conformation traits (CT) have been proposed as indirect indicators for the improvement of productive and sanitarian parameters. The CT can be classified in groups associated with body, feet and legs, rump, and udder (Corrales et al., 2011). Unlike productive traits, these characters can be more easily and earlier measured, and possess genetic correlations with the traits of interest (Berry et al., 2004).
For grazing production systems, such as those that exist in Colombia, the locomotion traits are very important. Animals with bad locomotion have not easy access to feed and milking parlors, therefore, the labor and animal welfare beyond profitability will be affected (Pérez et al., 2006). Feet and legs morphology is related to hoof erosion and locomotion diseases, commonly leading to lameness. This disease produces economic losses due to treatment dispensed and the involuntary culling of cows (Pérez et al., 2006).
It is possible to develop new selection index that includes not only important productive traits, but also some CT which may contribute to increase the productive life of dairy cows, reduce the incidence of certain diseases and improve breeding programs by using more easily measured parameters.
The objective of this study was to estimate the phenotypic association between some CT and milk traits (MT) in the Antioquia Holstein dairy cattle.
Materials and Methods
Milk traits measurement
Data from 8037 lactations from 139 herds of Holstein cows, participating of the milk control program, of 19 municipalities of the Antioquia department, were used in analysis. The cows were from the first up to the eleventh lactation occurred between the years 2008 and 2011. The available traits were: milk yield (MY), protein percentage (PP), fat percentage (FP) and somatic cell count (SCC). In mechanical milking herds, milk production was measured in proportional passage meters (Waikato® cow milk meters, ICAR approved), and herds with hand milking, a bucket weighing precision scale was used. Milk samples approximately 50 cm3 were taken in a container with Bronopol® (Biotrends, Bogotá, Colombia). In mechanical milking herds, the sample was taken directly from the meter with automatic mixing prior, and for hand milking the sample was collected directly from the bucket after homogenization. Fat and protein percentage, and somatic cell count were determined using the MilkoScan FT120® (Biotrends, Bogotá, Colombia). This equipment uses the principle of Fourier Transform Infrared (FITR) and accepted by the International Committee for Animal Recording (ICAR, 2012).
Linear evaluation
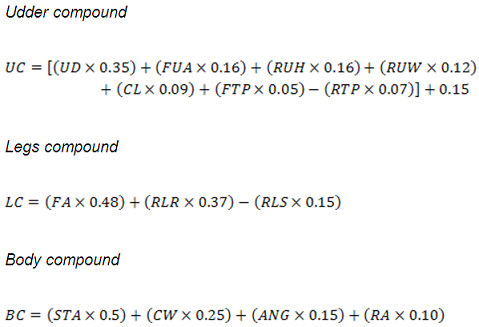
Four different classifiers scored 16 traits on each cow: stature (STA), chest width (CW), angularity (ANG), rump angle (RA), rump width (RW), foot angle (FA), rear legs side view (RLS), rear legs rear view (RLR), udder depth (UD), central ligament (CL), fore udder attachment (FUA), front teat position (FTP), teat length (TL), rear udder height (RUH), rear udder width (RUW) and rear teat position (RTP). Traits were classified on a scale of 1 to 9, according to biological extremes in agreement to the methodology proposed by ICAR (2012). From these traits, three compounds were calculated as follows; according to the methodology proposed in Sire Summaries (1991), with some modifications:
Data analysis
The somatic cell count (SCC; cells/µl) was transformed in the logarithmic form, somatic cell score (SCS), as follows:
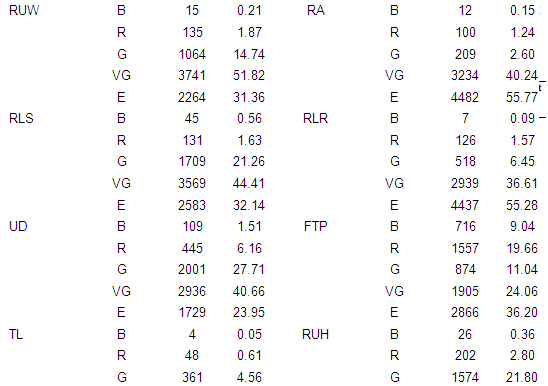
The scores for linear conformation traits score were converted into different qualification scales to permit the descriptive analysis of the population, since not always the maximum score corresponds to the desired optimal for the breed. For STA, CW, ANG, RW, CL, FUA and RUW the scores 1 and 2 correspond to bad (B), 3 and 4 to regular (R), 5 and 6 to good (G), 7 and 8 to very good (VG) and 9 to excellent (E). Whereas for RA, RLS, RLR, UD, FTP, TL, RUH and RTP the scores 1 and 9 correspond to bad, 2 and 8 to regular, 3 and 7 to good, 4 and 6 to very good and 5 to excellent.
To perform the descriptive analysis of MT were performed various measures of central tendency and dispersion to know the behavior of them in this population, while the description of the CT was made by contingency tables to identify the population distribution in the qualification scale proposed.
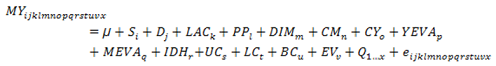
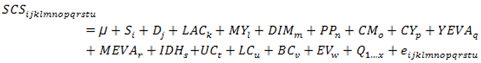
To determine the relationship between CT and MT, three different statistical analyses were carried out. It was used a generalized linear model as follow:
Where MY is the observation for the milk yield, µ is the overall mean for milk yield, Si and Dj are the fixed effect of sire and dam respectively, LACk, PPl, DIMm are covariates for lactation number, protein percentage and days in milk, respectively. CMn is the fixed effect of calving month, CYo is the fixed effect of calving year, YEVAp is the fixed effect of year of evaluation, MEVAq is the fixed effect of month of evaluation, IDHr is the fixed effect of the herd, UCs, LCt and BCu are the covariate for udder, legs and body compound, respectively, EVv is the fixed effect of the linear type trait evaluator, Qx is any other conformation trait included in the model and eijklmnopqrstuvx is the residual error.
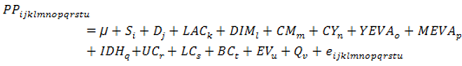
Where PP is the observation for the protein percentage, µ is the overall mean for protein percentage.
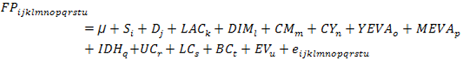
Where FP is the observation for the fat percentage, µ is the overall mean for fat percentage.
Where SCS is the observation for the somatic cell score, µ is the overall mean for somatic cell score.
To determinate the magnitude of the effect a regression analysis was carried out. The models of linear regression used were the following:
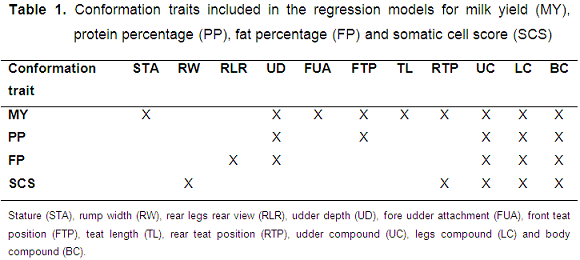
Where MY is the dependent variable, βo is the intercept, PP, LAC and DIM are the independent variables, β1, β2 and β3 are the regression coefficient between PP, LAC, DIM and MY respectively. Qn are the conformation traits included in the model, shown in Table 1, and βn are the regression coefficients of milk yield on conformation traits, and e is the residual error.
Where PP is the dependent variable, β0 is the intercept, MY, FP, LAC and DIM are the independent variables, β1, β2, β3 and β4 are the regression coefficient between MY, FP, LAC, DIM and PP respectively. Qn are the conformation traits included in the model, shown in Table 1, and βn are the regression coefficients of protein percentage on conformation traits, and e is the residual error.
Where FP is the dependent variable, β0 is the intercept, MY, PP, LAC and DIM are the independent variables, β1, β2, β3 and β4 are the regression coefficient between MY, PP, LAC, DIM and FP, respectively. Qn are the conformation traits included in the model, shown in Table 1, and βn are the regression coefficients of fat percentage on conformation traits, and e is the residual error.
Where SCS is the dependent variable, β0 is the intercept, MY, PP, LAC and DIM are the independent variables, β1, β2, β3 and β4 are the regression coefficient between MY, PP, LAC, DIM and SCS, respectively. Qn are the conformation traits included in the model, shown in Table 1, and βn are the regression coefficients of SCS on conformation traits, and e is the residual error.
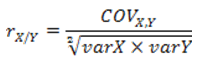
The associations between the MT and CT and between CT were done using the Pearson correlation coefficient according to the next formula:
All statistical analyzes were performed with SAS 9.0 software (1994).
Results and Discussion
Descriptive analysis
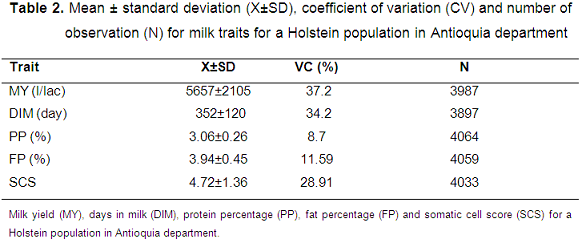
The mean, standard deviation, coefficient of variation coefficient and number of observation for the milk traits are given in Table 2. The mean for MY found was similar than others reported in the literature. Echeverri et al. (2011) reported a milk production of 4482 l for Antioquia department, whereas Corrales et al. (2011) found a higher mean for the same department (7155 l). The mean for PP and FT was also similar to literature (Corrales et al., 2011; Echeverri et al., 2011).
Holstein population of Antioquia presented in its most (89.41%) an excellent body conformation, instead, the larger proportion population showed regular (43.46) or good legs conformation (44.85%; Table 3). 82.2% of the animals had an excellent or very good qualification for udder conformation.
Effect of conformation traits score on milk traits
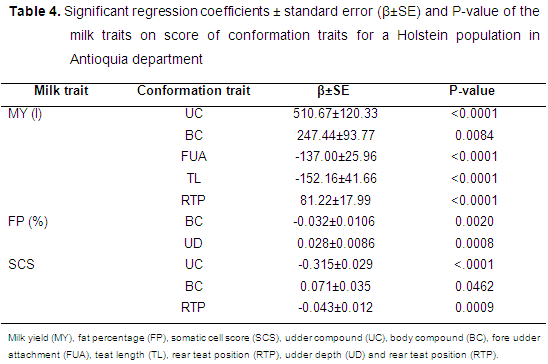
Milk yield. MY was significantly affected (P<0.01) by the S, LAC, PP, CY, CM, IDH, DIM, BC, UD and YEVA. The model proposed had a determination coefficient (R2) of 0.7327. The regression coefficient of the MY on CT are shown in Table 4. MY increased 510.67 l for each unit increase in the CU score, while decreased 137 l and 152.16 l when FUA and TL increased, respectively, in one unit.
Protein percentage. The PP was significantly affected (P<0.05) by the S and UD, as well by MY, DIM, FP, CM, CY and IDH (P<0.01). The model used showed R2= 0.5961. When the regression analysis was performed, none of the conformation traits had a significant regression coefficient (P>0.05).
Fat percentage. The FP was significantly affected (P<0.01) by DIM, LAC, PP, CM, CY, IDH, and BC, as well by S (P<0.05). The R2 of the model used was of 0.5841. FP decreased and increased in 0.0329% and 0.0289%, for each unit increase of BC and UD, respectively (Table 4).
Somatic cell score. The SCS was significantly affected by LAC, MY, DIM, PP, CY, IDH, YEVA, UC and BC (p<0.01), and by S and RW (p<0.05). The model had an R2= 0.4907. For each unit increase of UC and RTP the SCS decreased in 0.31 and 0.04, respectively (Table 4). On the contrary, when the score for BC increased in one unit, the SCS increased in 0.07.
Association between conformation traits and milk traits
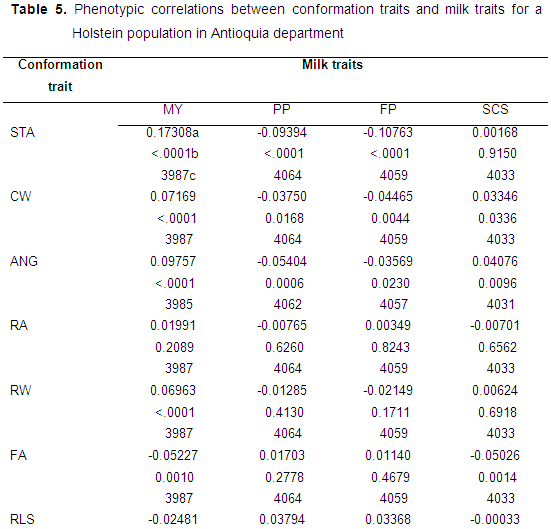
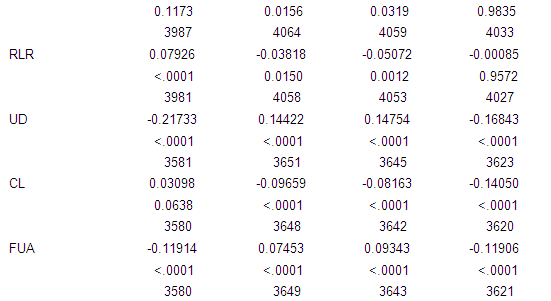
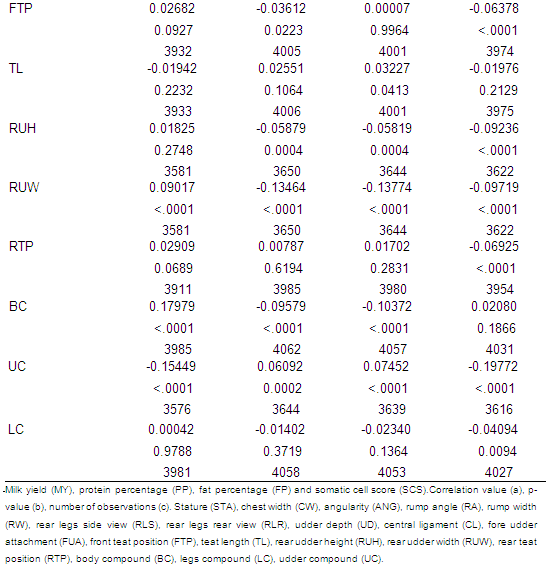
The correlation between STA and MY was moderately positive (0.17; Table 5), this relationship could have been greater if the first parity animals were not included, as these have not completed their adult size; in contrast to correlations between MY with PP and FP that were negative association (-0.09 and -0.10 respectively). This indicates that taller cows produce more milk, and because of the negative relation between volume and percentage of solids in milk, these animals have a minor PP and FP. This correlation between MY and STA is slightly greater than reported in the literature. Visscher & Goddard (1995) reported a correlation of 0.10 for these traits for Australian dairy cattle. ANG also had low and positive (0.09) correlation with MY. Visscher & Goddard (1995) also reported the same value for this latter correlation. UD showed moderately correlation with all productive traits (Table 5). The negative correlation between UD and SCS has a positive implication since a lower SCS indicates a better milk quality. For SCS Němcová et al. (2007) also found negative association between SCS and some CT related to the udder in Holstein cows of Czech Republic. These authors found that highest values of SCS occurred mostly at the lowers scores for UD, FUA, CL, and RUH. This way, cows with low and weak udder characteristics tend to have a higher SCS. Other authors had found the same results in Holstein cows in Nebraska and Switzerland (DeGroot et al., 2002; Kadarmideen, 2004). A different result had been found for the relation between MY and TL. Němcová et al. (2007) showed that the highest values for MY occurred at the higher and middle score for TL. No association between these traits was observed in our study. On the other hand these authors also reported negative correlations between fore udder attachment, udder cleft and udder depth have with milk yield, and positive correlation between this latter trait and udder height (Němcová et al., 2007). DeGroot et al. (2002) reported that traits related to udder attachment had negative genetic relationship with milk yield, whereas udder capacity traits had positive relationship with MY. Visscher & Goddard (1995) reported that the association between MY and FUA not exist for Australian dairy cattle which differs from the results reported in this paper (-0.12). These authors also reported different standard of association between milk yield and the traits related to the mammary system (positive and low association of 0.13), while we found a negative correlation between MY and udder compound (-0.15). Duru et al. (2012) reported correlations of 0.05, 0.00, -0.19, 0.16 and 0.04 between MY and STA, FUA, UD, BC and UC respectively, in Holstein cows of Bursa, Turkish. The association between MY and UD obtained by Rogers (1993) was -0.20. The majority of these results are similar with our, not only in magnitude, but also in direction. Esteves et al. (2004) studied the association between milk production and some linear CT in Holstein cattle in Brazil. They showed that the correlations between MY and STA, FUA, RUW, UD and ANG were of 0.06, -0.07, 0.16, -0.10 and 0.14, respectively. In general, the majority of these results were lower than those presented in this investigation, except for RUW and ANG, which were greater but have the same direction. Pantelić et al. (2012) found for Holstein cows correlations of -0.05 and -0.10 between MY and UD and FUA respectively, which were similar to those found in this study. These same authors reported for FP an association of 0.06 with UD, slightly different to the correlation presented in this paper.
The correlations between CL with PP and SCS were low and negative (-0.09 and -0.14, respectively), that indicates that cows with higher CL scores produce less protein but from the sanitary standpoint, the milk quality is better. FUA had a negative correlation with MY and SCS (-0.11) indicating that cows with stronger udder attachments have a lower milk production and better quality. RUW showed a low and positive correlation with MY (0.09) but low and negative with SCS (-0.09). The correlation between PP and FP was moderate and negative (0.13), indicating that a higher score on RUW causes a major milk volume, with lower content of solids and lower somatic cell count. BC had low and negative correlations with PP and FP (-0.09 and -0.13, respectively) and a moderate and positive correlation with MY (0.17). Finally, the UC had a negative correlations with MY (-0.15) and SCS (-0.19), that means that cows with larger, stronger and better attachment udders have a lower presence of somatic cells and lower milk production.
Ptak et al. (2008) reported association between CT and SCS for the Holstein breed. Overall udder score had a correlation of -0.09 with SCS, which is similar to that found in this study. They also reported that between SCS and CL exists a correlation of -0.10 which is consistent with the results presented in this research. They also reported low correlations between SCS with RA (0.02), RLS (0.02) and TL (-0.03). For other CT as RW, FA and RLR the correlation with SCS were 0.00. De Haas et al. (2007) estimated the correlation between MT and CT in three different Swiss dairy cattle breeds. For Holstein they found that between MY and STA the correlation was 0.29, between STA witn FT and PP the correlations were 0.01 and between SCS and STA was of -0.01. They also evaluated the relationship between these four MT with RW and found higher and positive values.
It can be seen that exist moderate and negative associations between milk production and conformation/capacity traits, indicating that animals with stronger appearance produced more milk. The wide rear udder shows a positive correlation with average production, showing that cows with wider udders produce more milk. Others characteristics of the mammary system, like UD and FUA, presents unfavorable association with MY. Apparently, cows with higher productions tend to present deeper and weakly inserted udders. This unfavorable relationship, should be observed when selection by MY does not consider CT, since the conformation of the udder is also important to the functionality of the animal. Thus, it is suggested that deeper udders could be reliable predictors of greater milk production (Esteves et al., 2004). These authors also pointed out that the depth of the udder is the traits that result in a higher culling rate than others, so this characteristic is the most responsible for the exclusion of animals from herds.
The phenotypic correlation between traits in cattle breeding relates to presence of common positive or negative covariance, occurring as the result of the effect of genetic and environment factors. Determination of the level of correlation between two or multiple traits depends greatly on the level of their expression. The knowledge of phenotypic and genetic correlations between body traits can help in defining of the breeding goal, but also in harmonizing the scoring criteria (Pantelić et al., 2012).
Conclusion
Conformation traits that showed a positive relation with milk yield had a negative association with protein and fat percentage caused by the negative correlation between volume of milk and percentage of solids. This way, all traits that present positive effect on milk yield will have negative response on fat and protein percentage.
Although the phenotypic correlation has an environmental component, also has a genetic component, which is necessary to analyze to determine whether some of these conformation traits are suitable for inclusion in breeding programs.
Acknowledgments
Appreciation is expressed to collaborators and dairy farmers for providing data.
References
· Berry, D.P.; Buckley, F.; Dillon, P. et al. Genetic relationships among linear type traits, milk yield, body weight, fertility and somatic cell count in primiparous dairy cows. Irish Journal of Agricultural and Food Research, v.43, n.2, p.161-176, 2004. · Cary, N.C. SAS User’s Guide: Statistic. Statistical Analysis System. Institute Inc., 1994. · Corrales, J.; Cerón, M.; Cañas, J. et al. Parámetros genéticos de características de tipo y producción en ganado Holstein del departamento de Antioquia. Revista MVZ Córdoba, v.17, n.1, p.2870-2877, 2011. · De Haas, Y.; Janss, L.L.G.; Kadarmideen, H.N. Genetic and phenotypic parameters for conformation and yield traits in three Swiss dairy cattle breeds. Journal of Animal Breeding and Genetics, v.124, n.1 p.12-19, 2007. · DeGroot, B.J.; Keown, J.F.; Van Vleck, D, et al. Genetic parameters and responses of linear type, yield traits, and somatic cell scores to divergent selection for predicted transmitting ability for type in Holsteins. Journal of Dairy Science, v.85, n.6, p.1578-1585, 2002. · Duru, S.; Kumlu, S.; Tuncel, E. Estimation of variance components and genetic parameters for type traits and milk yield in Holstein cattle. Turkish Journal of Veterinary and Animal Sciences, v.36, n.6, p.585-591, 2012. · Echeverri, J.; Arango, J.; Parra, J.E. Análisis comparativo de los grupos genéticos Holstein, Jersey y algunos de sus cruces en un hato lechero del norte de Antioquia en Colombia. Zootecnia Trop. v.29, n.1, p.49-59. 2011. · Esteves, A.M.C.; Bergmann, J.A.G.; Durães, M.C. et al. Correlações genéticas e fenotípicas entre características de tipo e produção de leite em bovinos da raça Holandesa. Arquivo Brasileiro de Medicina Veterinária e Zootecnia, v.56, n.4, p.529-535, 2004. · Holstein Association of America. Sire Summaries. Holstein Association of America, Brattleboro, v.2, 1991. · International Committee for Animal Recording - ICAR. International Agreement of Recording Practices. Ireland, 2012. 612p. · Kadarmideen, H.N. Genetic correlations among body condition score, somatic cell score, milk production, fertility and conformation traits in dairy cows. Animal Science, v.79, p.191-201, 2004. · Němcová, E.; Štípková, M.; Zavadilová, L. et al. The relationship between somatic cell count, milk production and six linearly scored type traits in Holstein cows. Czech Journal of Animal Science, v. 52, n.12, p.437-446, 2007. · Pantelić, V.; Nikšić, D.; Ostojić-Andrić, D. et al. Phenotypic and genetic correlations of milk and type traits of holstein-friesian bull dams. Journal for the Improvement of Animal Husbandry, v.28, n.1 p.1-10, 2012. · Pérez, M.A.; García, C.; González, O. et al. Genetic and phenotypic relationships among locomotion type traits, profit, production, longevity, and fertility in Spanish dairy cows. Journal of Dairy Science, v.89, n.5 p.1776-1783, 2006. · Ptak, E.; Jagusiak, W.; Zarnecki, A. Relationship between test day somatic cell score and conformation traits in Polish Holstein cattle. 59th Annual Meeting of the European Association for Animal Production. Vilnus, Lithuania; 2008. p.1-6. · Rodriguez-Zas, S.L.; Gianola, D.; Shook, G.E. Evaluation of models for somatic cell score lactation patterns in Holsteins. Livestock Production Science, v.67, n.1-2, p.19-30, 2000. · Rogers, G.W. Index selection using milk yield, somatic cell score, udder depth, teat placement, and foot angle. Journal of Dairy Science, v.76, n.2, p.664-670, 1993. · Samoré, A.B.; Rizzi, R.; Rossoni, A. et al. Genetic parameters for functional longevity, type traits, somatic cell scores, milk flow and production in the Italian Brown Swiss. Italian Journal of Animal Science, v.9, n.2, p.145-152, 2010. · Valencia, M.; Montaldo, H.H.; Ruíz, F. Parámetros genéticos para características de conformación, habilidad de permanencia y producción de leche en ganado Holstein en México. Revista Técnica Pecuaria en México, v.46, p.235-248, 2008. · Visscher, P.M.; Goddard, M.E. Genetic parameters for milk yield, survival, workability, and type traits for Australian dairy cattle. Journal of Dairy Science, v.78, n.1, p.205-220, 1995.
Madrid, S.; Echeverri, J. Association between conformation traits and productive performance in Holstein cows in the department of Antioquia, Colombia. Veterinaria y Zootecnia, v.8, n.1, p.35-47 , 2014.
< http://200.21.104.25/vetzootec/index.php?option=com_content&view=article&id=111> |


 | Today | 139 |
 | Yesterday | 322 |
 | This week | 2512 |
 | Last week | 3043 |
 | This month | 7616 |
 | Last month | 10358 |
 | All days | 1295251 |
Online Now: 6
Your IP: 3.129.20.163
MOZILLA 5.0,
Today: July 20, 2024
Your IP: 3.129.20.163
MOZILLA 5.0,
Today: July 20, 2024